Today Monday April 6th 2026, at about 7:05p.m. (Eastern time ET) or Tuesday 12:05a.m. (Irish Standard time IST) the Orion Capsule navigated by the European Space Agency’s European Service Module, will reach the furthest point in its trajectory from Earth on its lunar flyby. This point will also be the furthest point from Earth humans have ever traveled, with a distance of approximately $406777 \rm km$. Before that, there was Apollo 13, which made it $400171\rm km$ from Earth.
In this post, we will investigate the Artemis II trajectory data found of the official NASA website, using Python. The trajectory data is stored in text file with a .asc extension. The dataset is defined in an Earth-centered inertial reference frame (EME2000), meaning all position and velocity vectors are expressed relative to the center of the Earth in a non-rotating coordinate system aligned with the Earth’s mean equator and equinox at the J2000 epoch. The time system used throughout the ephemeris is Coordinated Universal Time (UTC), and all timestamps are provided in ISO 8601 format.
The dataset contains the following columns:
| Column | Description |
|---|---|
| TIME | Timestamp of each state vector, given in ISO 8601 format and expressed in Coordinated Universal Time (UTC) |
| X position | The spacecraft’s position along the X-axis in the EME2000 frame, measured in kilometers |
| Y position | The spacecraft’s position along the Y-axis in the EME2000 frame, measured in kilometers |
| Z position | The spacecraft’s position along the Z-axis in the EME2000 frame, measured in kilometers |
| X velocity | The spacecraft’s velocity in the X-direction, measured in kilometers per second |
| Y velocity | The spacecraft’s velocity in the Y-direction, measured in kilometers per second |
| Z velocity | The spacecraft’s velocity in the Z-direction, measured in kilometers per second |
The Artemis II Trajectory
The following figure shows the entire trajectory of the Artemis II mission. Beginning at Earth, centred at the origin, the spacecraft follows an elliptical orbit around the Earth. It then performs a Trans-Lunar Injection (TLI), placing the spacecraft on a trajectory toward the Moon.
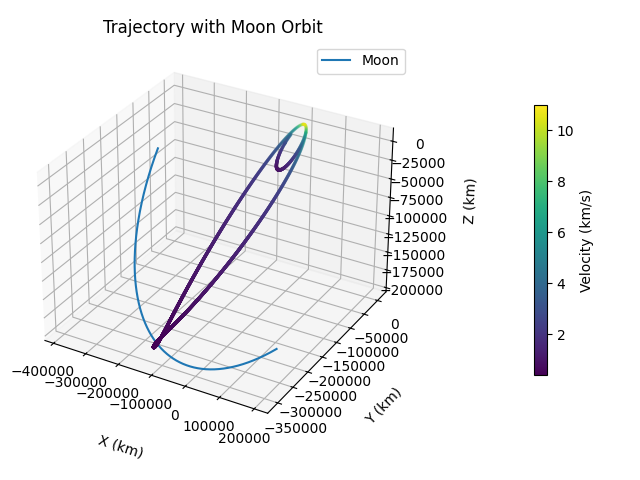
The velocity magnitude of the spacecraft is represented using a colour map. We can see it is the brightest around the perigee point, the point closest to the Earth. This occurs because Earth’s gravitational pull is strongest at this point, causing, the spacecraft to accelerate and reach its maximum kinetic energy. As the spacecraft moves away from Earth and continues its trajectory toward the Moon, it gradually exits Earth’s dominant gravitational influence, and its velocity decreases.
Using the astropy library in Python, we illustrated the Moon’s trajectory in blue. The following code is used to get the lunar trajectory:
import numpy as np
from astropy.time import Time
from astropy.coordinates import get_body, GCRS
import astropy.units as u

# Convert times to Astropy Time
times = Time(times_str)

# Get Moon position in Earth-centered inertial frame
moon_coords = get_body("moon", times)
moon_gcrs = moon_coords.transform_to(GCRS(obstime=times))

# Moon coords (in km)
x_moon = moon_gcrs.cartesian.x.to(u.km).value
y_moon = moon_gcrs.cartesian.y.to(u.km).value
z_moon = moon_gcrs.cartesian.z.to(u.km).value
On day 6 of the mission at 12:05a.m. IST, the Orion spacecraft will enter the Lunar sphere of influence. At this point, the Moon’s gravity becomes the dominant force acting on the spacecraft. The spacecraft will perform a lunar flyby and enter a trajectory influenced primarily by the Moon’s gravity, getting as close as approximately $6576.60 \rm km$ to the Lunar surface. The crew will make observations of the Moon’s surface from there spacecraft and test the systems.
The spacecraft will use the Moon’s gravity to assist their return home on a free return trajectory. The journey home will last 4 days, where the crew will make correction burns to ensure their return trajectory is correct.
Before returning, the European Service Module would detach from the crew module Integrity.
The Trajectory from Earth’s Sky
On Earth, we need to use horizontal coordinates instead of the traditional Cartesian. We assign each point we see in the sky a coordinate. We will adopt spherical coordinates, since the Earth is spherical, and we will ignore the radial dependence, as we are not interested in how far objects are from us, just where they appear in the sky, which can be represented through the angular parts.
The angular coordinates are called the altitude and azimuth. The altitude measures the angle of an object above the horizon, ranging from $0^{\circ}$ at the horizon to $90^{\circ}$ directly overhead, called the zenith. The azimuth, describes the direction along the horizon, starting at North at $0^{\circ}$ increasing eastwards back to North at $360^{\circ}$. This coordinate system is also known as the alt/az system.
Since the Earth rotates, objects in this coordinate system appear to rise, move across the sky, and set. Luckily, astropy has the tools required to convert the orbit to this coordinate system. The following code, converts Cartesian trajectories of the Spacecraft and Moon into the Geocentric Celestial Reference System (GCRS), which describes the trajectory relative to the center of the Earth. Then these are converted to the alt/az system from a chosen longitude and latitude location.
from astropy.coordinates import get_body
from astropy.coordinates import GCRS, ITRS, AltAz, EarthLocation

# Houston TX: 29.7601 deg N, 95.3701 deg W
location = EarthLocation(
    lat=29.7601*u.deg,
    lon=-95.3701*u.deg,
    height=15*u.m
)

# Convert times
times = Time(times_str)

# Spacecraft position in GCRS
sc_gcrs = GCRS(
    x=x_sc*u.km,
    y=y_sc*u.km,
    z=z_sc*u.km,
    representation_type='cartesian',
    obstime=times
)

# Transform to AltAz frame
altaz = sc_gcrs.transform_to(AltAz(obstime=times, location=location))

alt = altaz.alt.degree
az = altaz.az.degree

moon = get_body("moon", times, location)
moon_altaz = moon.transform_to(AltAz(obstime=times, location=location))

moon_alt = moon_altaz.alt.degree
moon_az = moon_altaz.az.degree
The following figure captures the trajectory of the spacecraft (blue) and the Moon (orange) as seen in the sky from Houston, Texas, USA. The red point, shown in the left panel, illustrates the location in the sky where the spacecraft reaches its furthest point from Earth, occurring at 12:05p.m. IST (7:05p.m. ET).
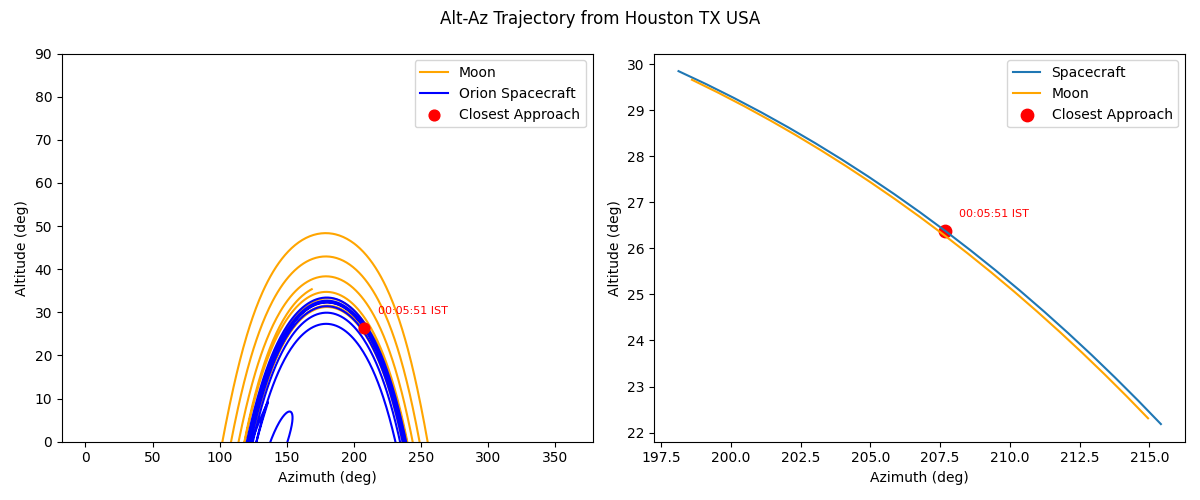
The left panel shows the full sky path, where the spacecraft rises above the horizon, traverses across the sky, and eventually sets, while the Moon follows its own apparent motion. The right panel provides a zoomed in view around the point of interest.
We do not observe the full trajectory or the point of interest from Houston because both Earth’s rotation and the Moon’s motion around Earth continuously change the apparent positions of objects in the sky. Since observations are made from a fixed location on Earth’s surface, only a portion of the spacecraft’s trajectory is visible above the horizon at any given time. As a result, the spacecraft must communicate with ground stations located at different positions around Earth. For the Artemis II mission, communication was supported by NASA’s Deep Space Network, which includes antennas located in Goldstone (California, USA), Madrid (Spain), and Canberra (Australia).
The code used to create the figures can be found here.
Conclusion
As the Orion spacecraft makes history orbits close to the lunar surface, reaching distances further than any humans in history, Artemis II marks an important milestone in space exploration. In this post, we visualised the trajectory of the Artemis II mission, transforming it from Cartesian coordinates to an Earth based observational perspective. This mission serves as a stepping stone to putting astronauts to the Moon in later Artemis missions.